I wish I knew. The next time I’ll just move it to another directory rather than deleting it.
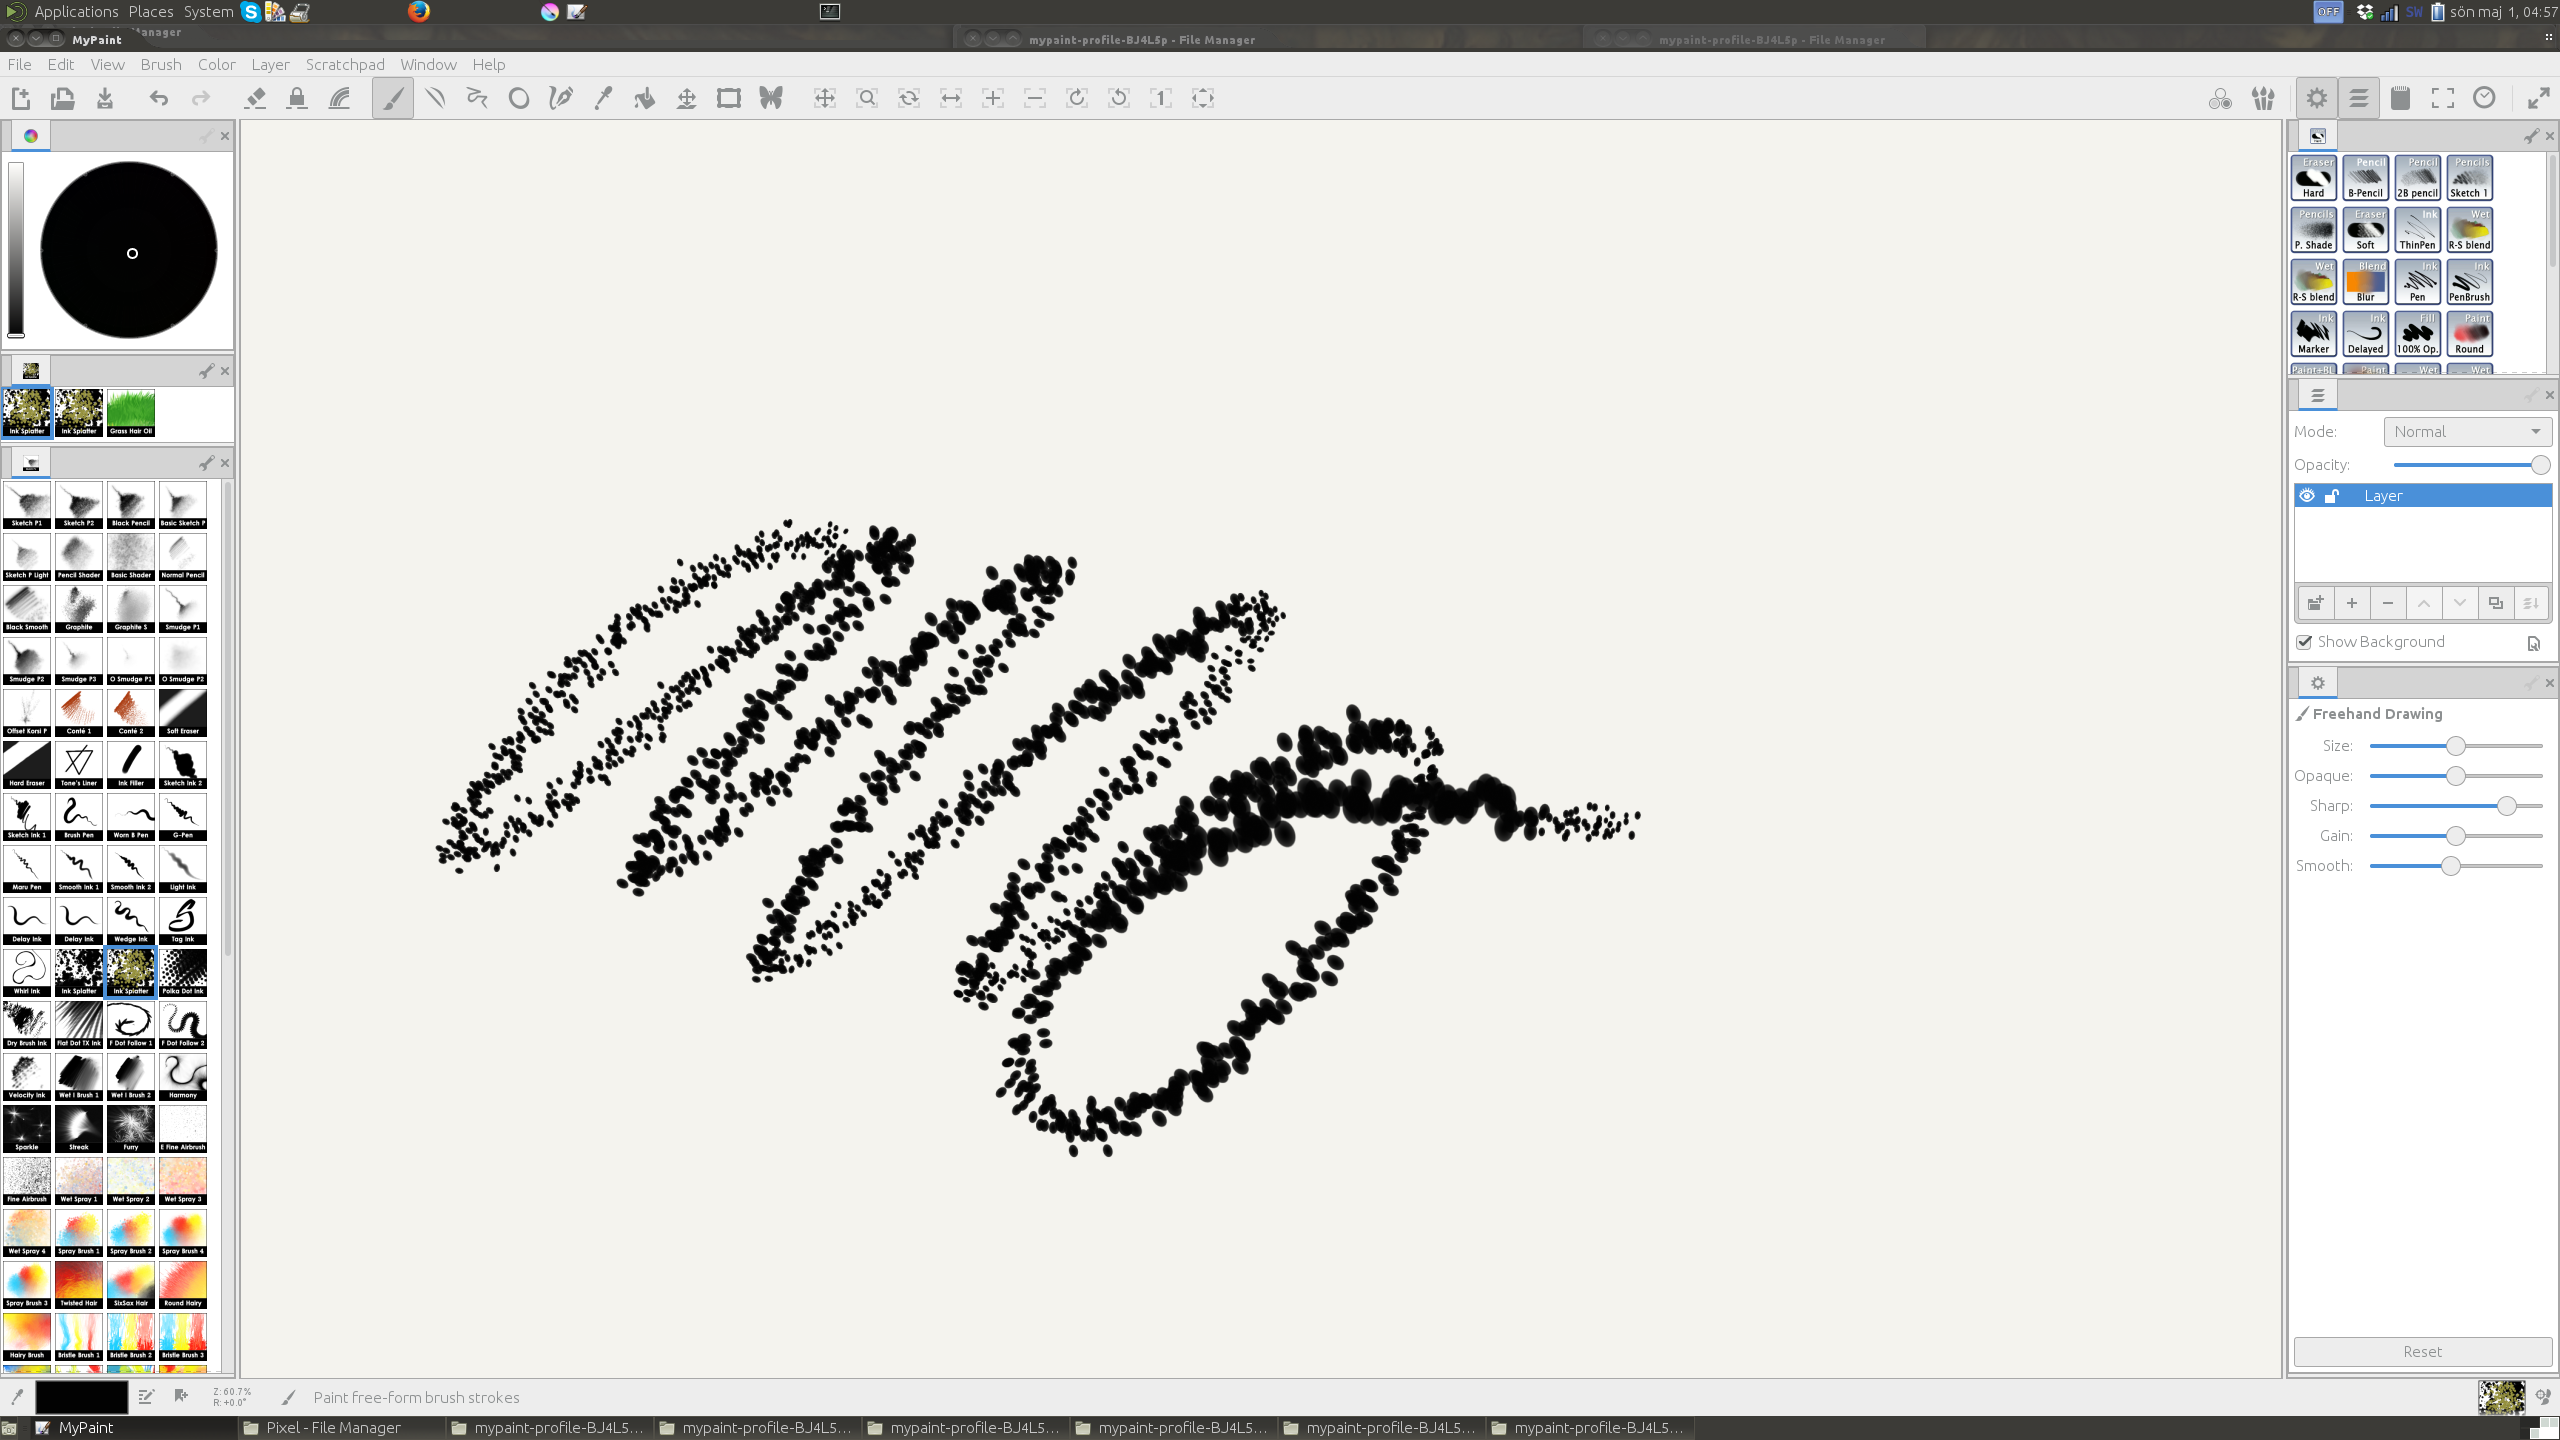
From the changes in MyPaint, I’d say it was mostly my panel layouts. The side panels with their contents of colour selector, a couple of brush sets and tool options disappeared after deleting settings.json.
The code path graph has a bit too much extra hair to be comfortable to read, so I’m sorry I didn’t get round to this earlier. You have to be a bit focussed on just one activity to cut down on the noise, that’s why docs advise binding it to keystrokes
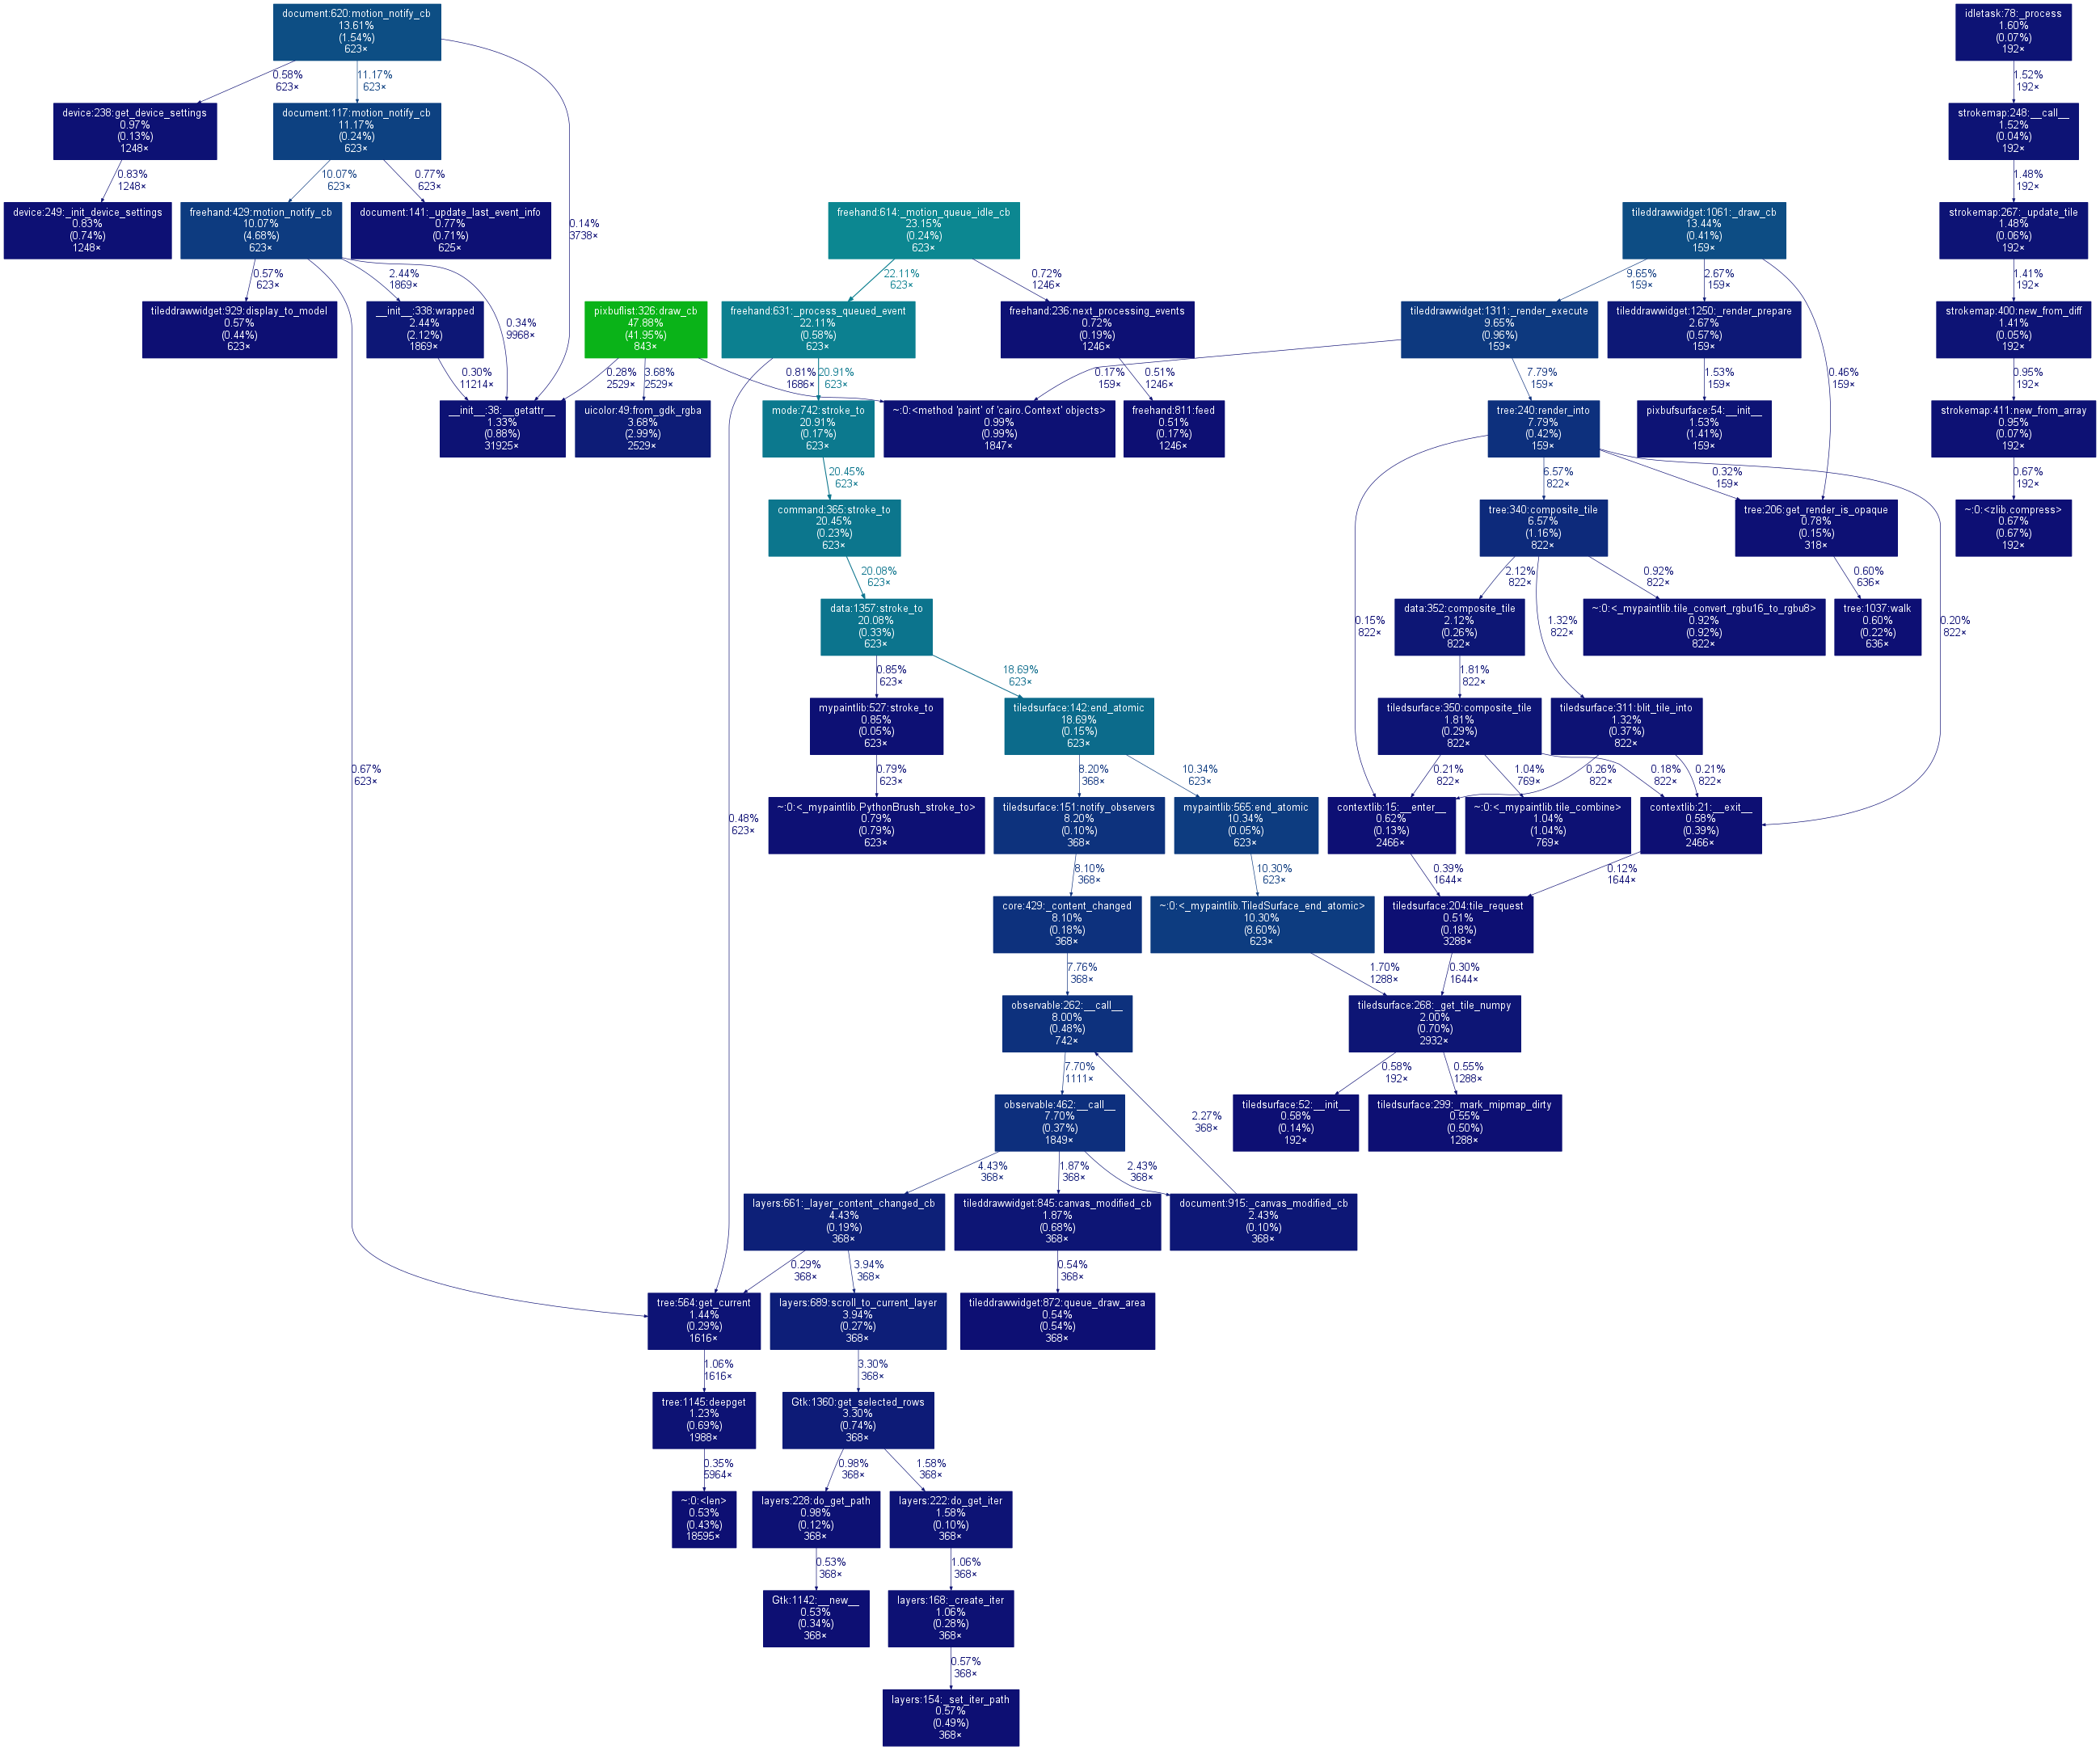
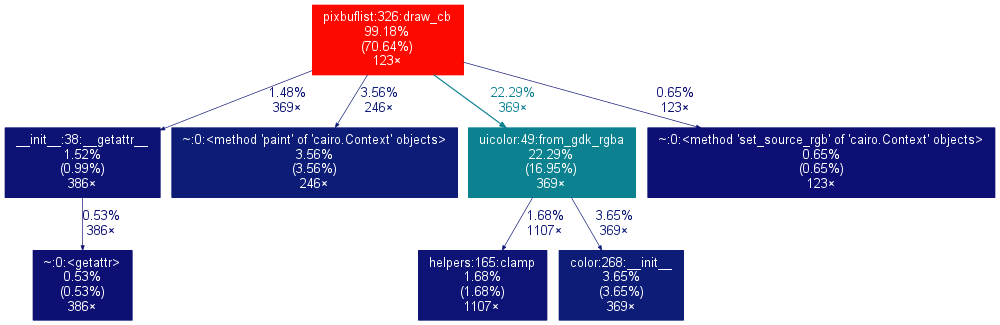
There seems to be too many calls to pixbuflist’s draw_cb() That’s the consistent little hot spot away from the drawing arc. Some layout issue is probably making it redraw too much, and I think that’s a bug proper along the lines of “pixbuflist: redraws too frequently”. Perhaps if a list is too long for its container, redraw ping-ping happens…
Please can you report this bug on the tracker? When you do, please paste in a link to this thread, because those call graphs are golden. Thank you!
It would be useful to know if it spends a lot of time in there when you aren’t drawing, or even moving the mouse, when the sidebars are visible.
It’s definitely doing too much redrawing. This is a profiling pass of about 3 seconds, done when the mouse was idle and not drawing. There was a single Favourites group packed in the sidebar which had a single brush in it. The pixbuflist shouldn’t be overloaded at all in this scenario, and there should be no calls to that draw_cb().
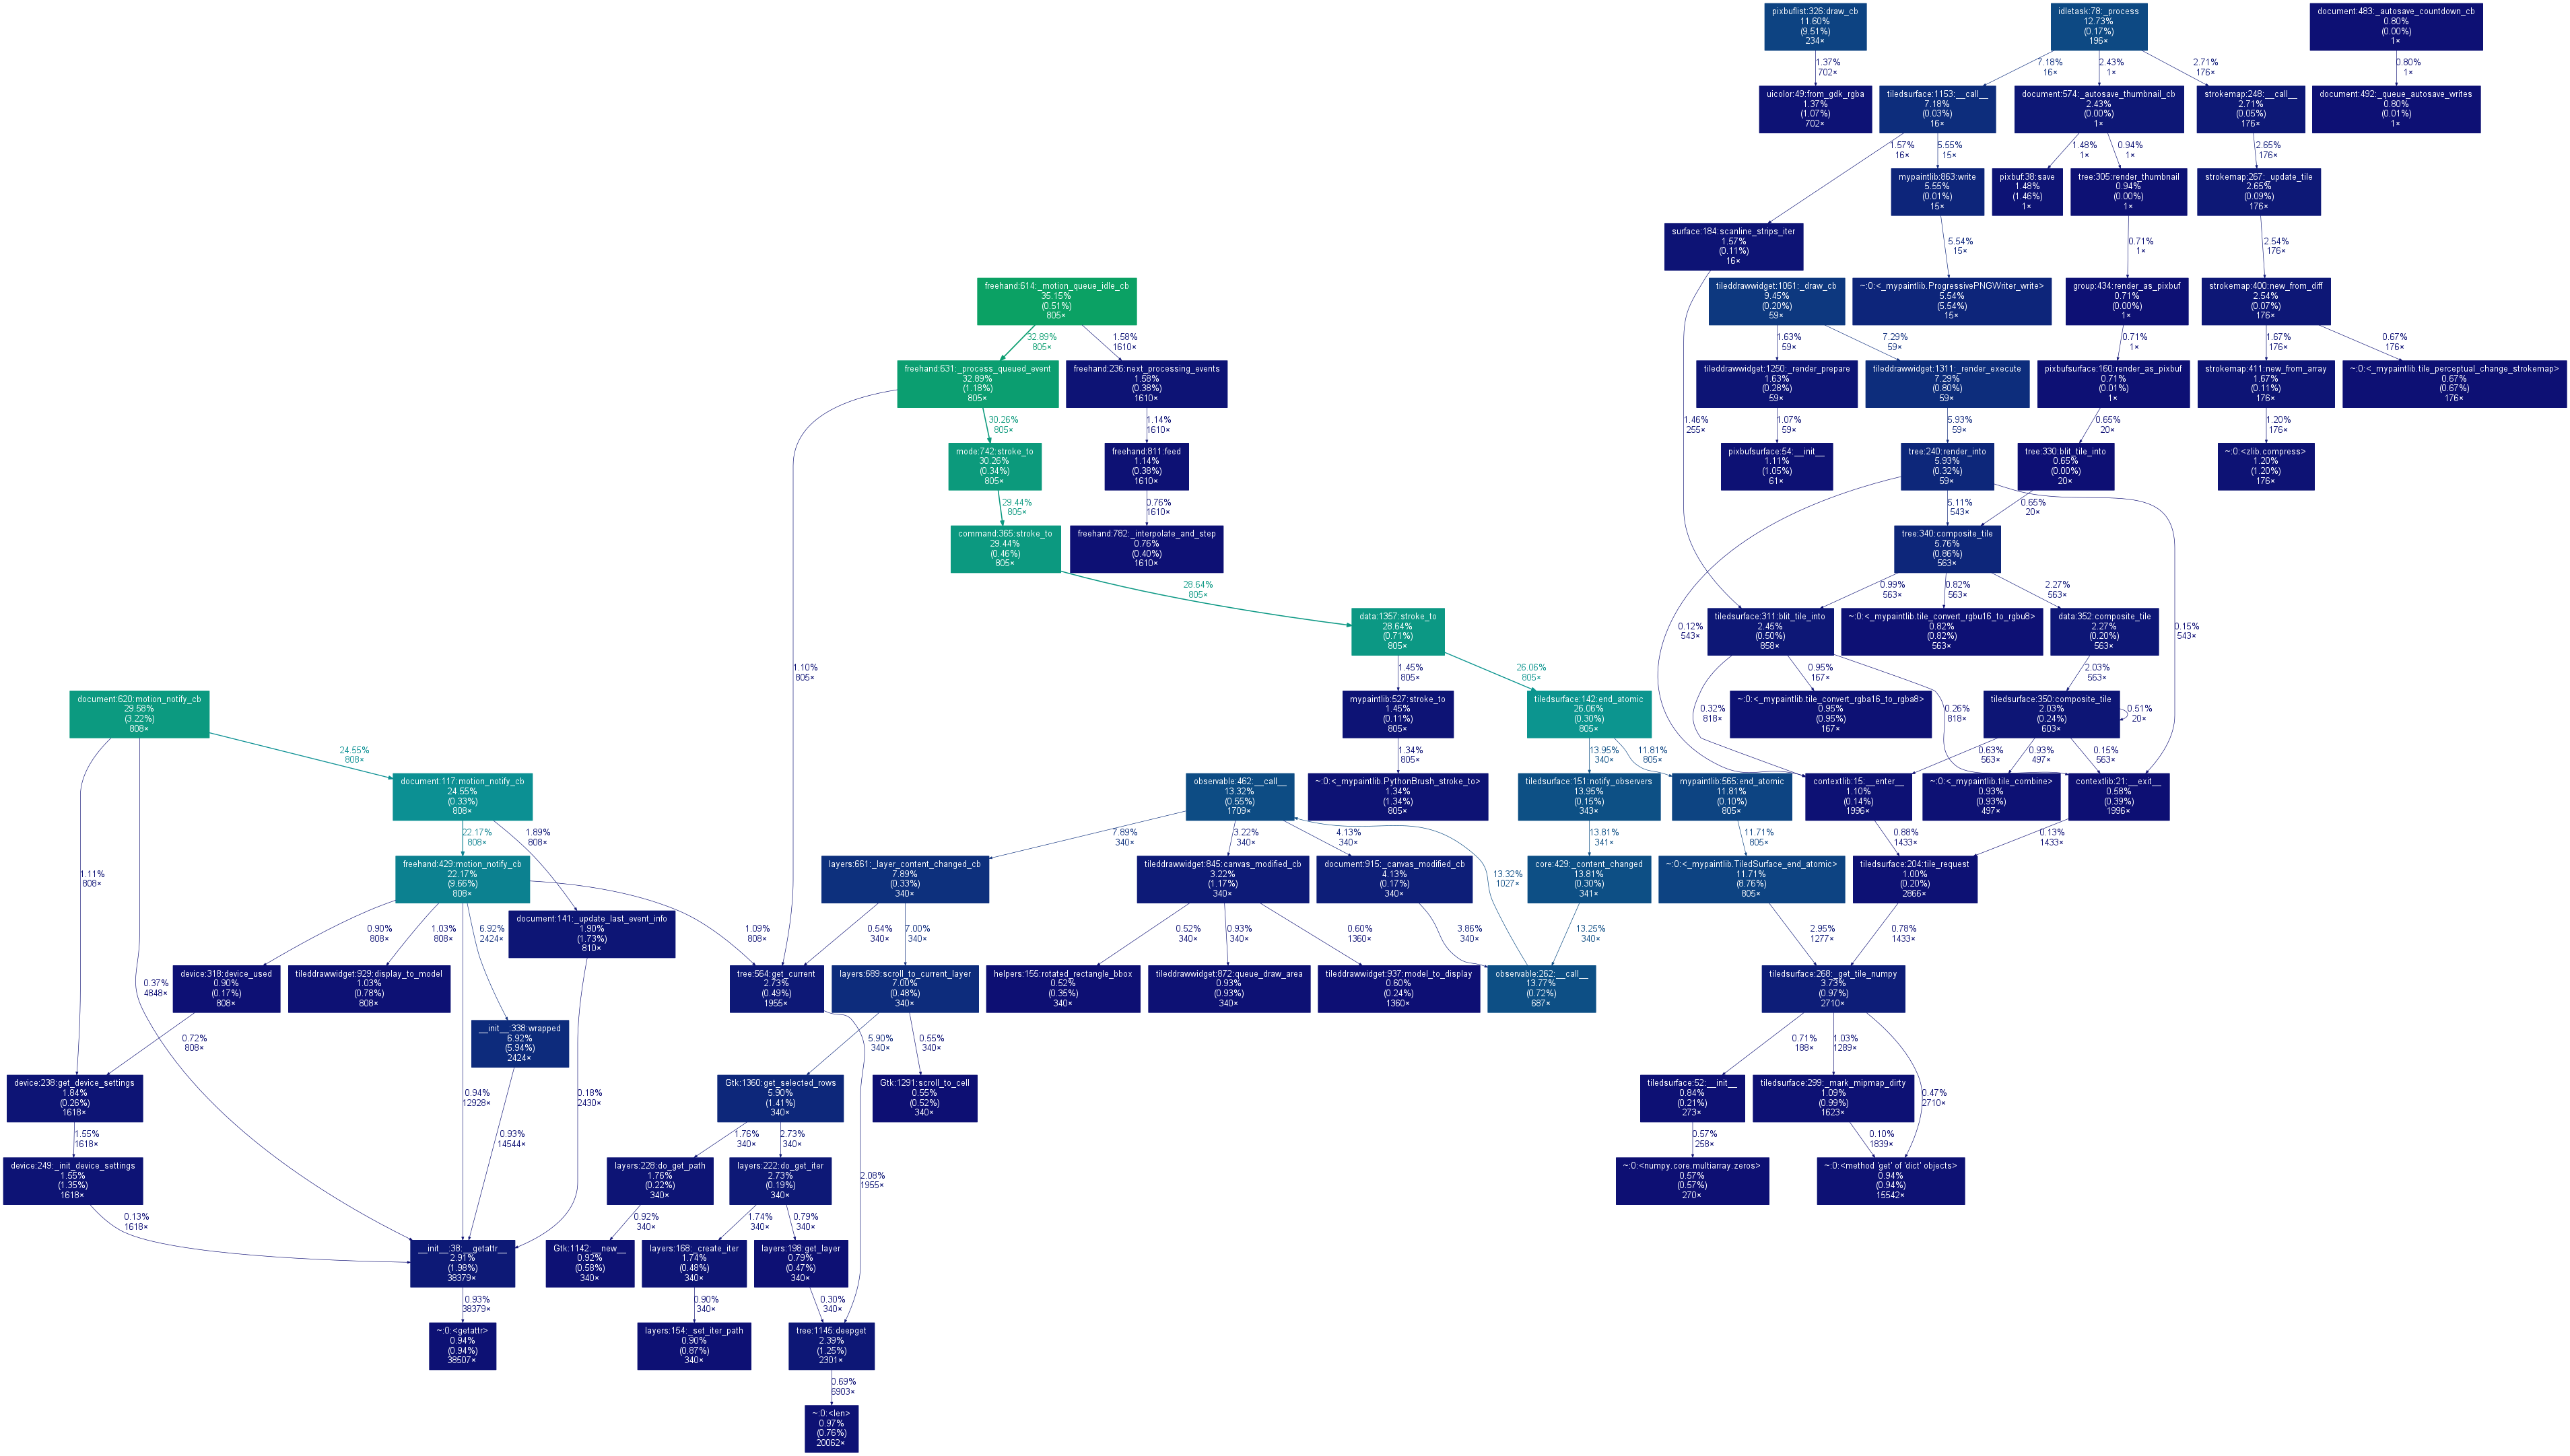
If the item is removed from the sidebar - hidden by clicking its X - the excess calls stop. Similarly, if an autohide has hidden the sidebar, the excess calls stop then too.
This also affects the background image preview list, which is also a pixbuflist.
I think we’ve got to the essence of this one now. Thanks for investigating the issue and showing us where to look! Next step is to subscribe to the issue tracker entry if you can: we might ask you for confirmation that the bug is gone later
Just to quickly mention that I was wondering what I did wrong for a couple of hours before discovering that the number of opened panels was indeed causing a slowdown in the processing of input events as described here. I would not have known otherwise on this low-end but still responsive device and now is back to a state as efficient as during a first-time run, which is probably why some users don’t directly see the correlation between the two right away. I can finally resume using it thanks to this archived thread.